Node-RED Fundamentals
Learn the basics of Node-RED: from installation to creating flows, working with nodes, and building interactive dashboards.
Introduction to Node-RED
Node-RED is a flow-based development tool for visual programming, primarily used for wiring together hardware devices, APIs, and online services. It is built on Node.js and provides a browser-based editor for creating flows.
Installing Node-RED
To install Node-RED, you need to have Node.js installed on your system. Follow these steps:
- Install Node.js from nodejs.org.
- Install Node-RED globally using npm:
npm install -g node-red
- Start Node-RED:
node-red
- Access the Node-RED editor by opening your browser and navigating to http://localhost:1880.
Creating Flows
Flows are the core of Node-RED. They consist of nodes connected together to define a sequence of operations. Here's how to create a simple flow:
- Drag and drop nodes from the palette onto the workspace.
- Connect the nodes by dragging from the output port of one node to the input port of another.
- Double-click a node to configure its properties.
- Deploy the flow by clicking the Deploy button.
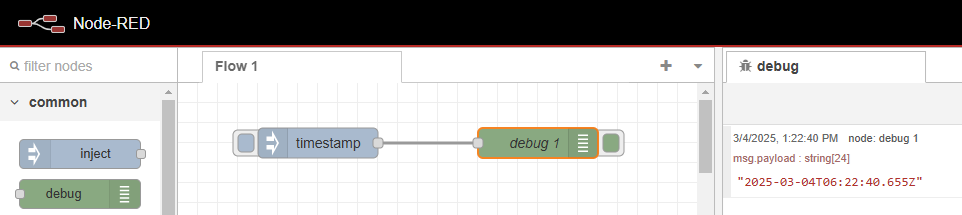
Example: Create a flow that injects a timestamp and logs it to the debug panel.
1. Drag an "inject" node onto the workspace.
2. Drag a "debug" node onto the workspace.
3. Connect the "inject" node to the "debug" node.
4. Deploy the flow and click the inject node to see the timestamp in the debug panel.
Working with Nodes
Nodes are the building blocks of Node-RED. They can perform various tasks, such as injecting data, processing data, or outputting data. Here are some common nodes:
- Inject Node: Injects messages into a flow.
- Debug Node: Displays messages in the debug panel.
- Function Node: Allows you to write custom JavaScript code.
- HTTP Node: Sends or receives HTTP requests.
- Dashboard Node: Creates UI elements for interactive dashboards.
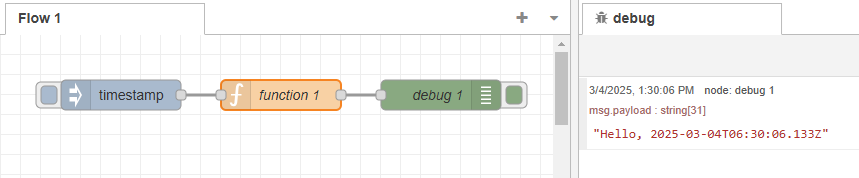
Example: Use a Function node to modify a message payload.
1. Drag an "inject" node onto the workspace.
2. Drag a "function" node onto the workspace.
3. Drag a "debug" node onto the workspace.
4. Connect the nodes in sequence: inject → function → debug.
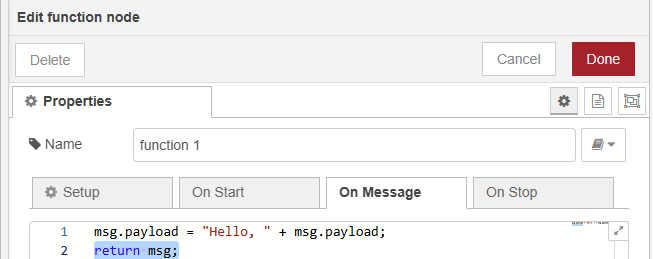
5. Double-click the function node and add the following code:
msg.payload = "Hello, " + msg.payload;
6. Deploy the flow and click the inject node to see the modified message in the debug panel.
Building Interactive Dashboards
Node-RED provides a dashboard module to create interactive user interfaces. Follow these steps to build a simple dashboard:
- Install the Node-RED Dashboard module:
npm install node-red-dashboard
- Restart Node-RED.
- Add dashboard nodes (e.g., gauge, chart, button) to your flow.
- Configure the nodes to display data or interact with your flow.
- Access the dashboard by navigating to http://localhost:1880/ui.
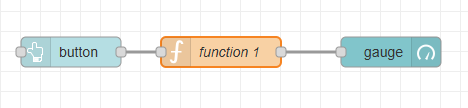
Example: Create a dashboard with a button and a gauge.
1. Drag a "button" node from the dashboard palette onto the workspace.
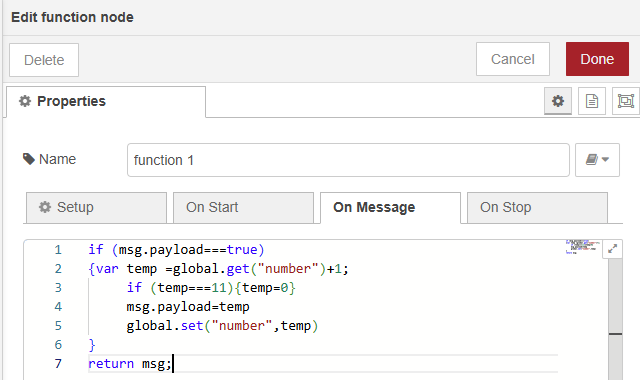
2. Drag a "function" node onto the workspace.
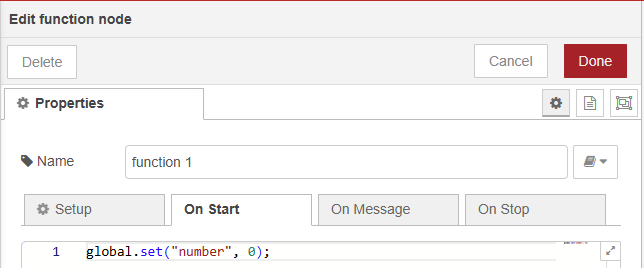
3. Double-click the function node and add the following code:
4. Drag a "gauge" node from the dashboard palette onto the workspace.
5. Connect the nodes in sequence: button → function → gauge.
6. Deploy the flow and open the dashboard UI.
7. Access the dashboard by navigating to http://localhost:1880/ui.
8. Click the button to see the gauge update.